Successful vascular interventions
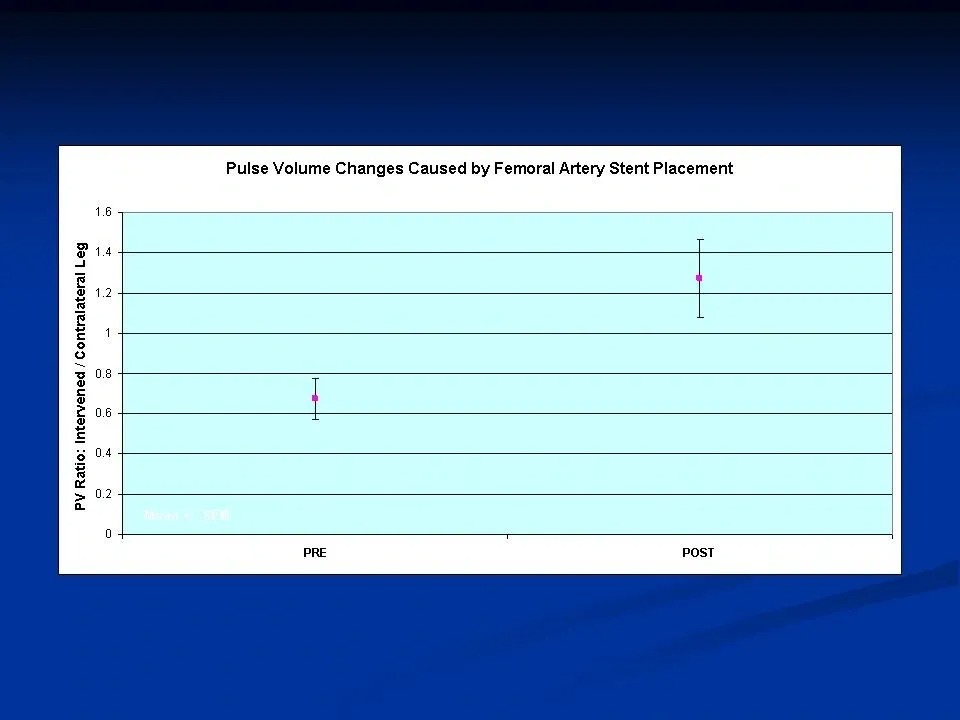
In this next graph, the results of 5 successful vascular interventions are summarized.
On the Y-Axis is the ratio of pulse volume in the intervened limb to the resting limb. As the graph shows, there is a 90% increase in this ratio (p < 0.05) The data points and respective error bars are the mean +/- SEM
