consistent increase in peripheral impedance
We have noticed a consistent increase in peripheral impedance that occurs as a patient is hemodialyzed and which appears to plateau about 2 hours into the procedure. We believe that this is an indication of the patient reaching their dry weight. We have also noticed a drop in pulse flow that precedes the drop in blood pressure which typically takes place about an hour into hemodialysis. We will need to obtain data from about 30 subjects before we can make statistically significant observations.
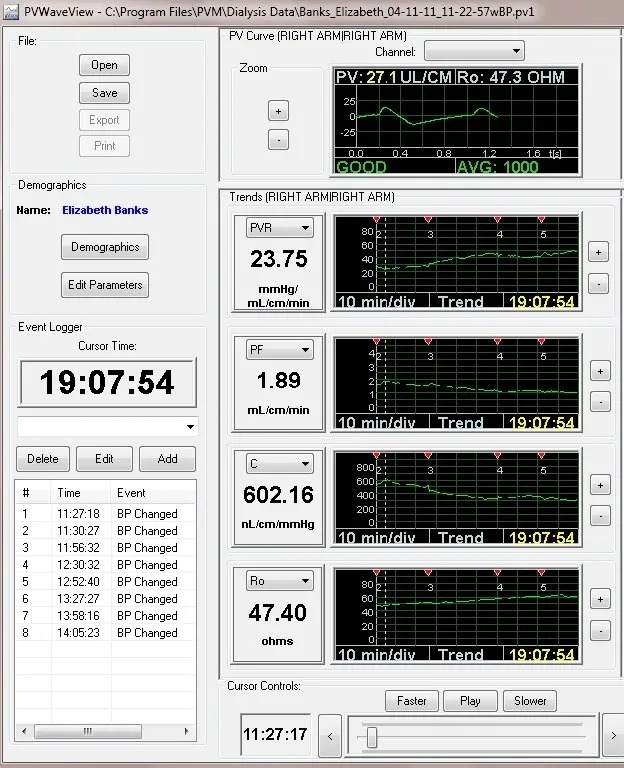
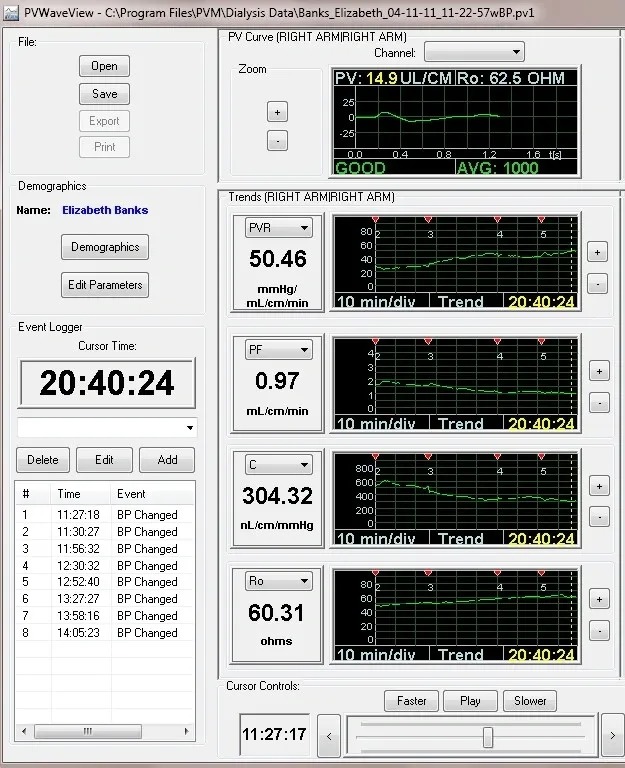
Here is a typical Pulse Flowmeter measurements for one of our subjects. These trend lines cover a 2 hour time interval. During this time, a hemodialysis patient loses a substantial amount of interstitial and intravascular fluid.
From top to bottom, the tracings are the starting pulse volume curve, the peripheral vascular resistance (PVR) trend line, the pulse flow (PF) trend line, the vascular compliance (C) trend line and the baseline impedance (Ro)trend line.
During dialysis, interstitial fluid is removed and tissue impedance (Ro) increases, in this case from 47 ohms to 60 ohms. This change tapers off after about 100 minutes, suggesting that the patient has achieved their dry weight.
Beginning of Dialysis

Two Hours Later

